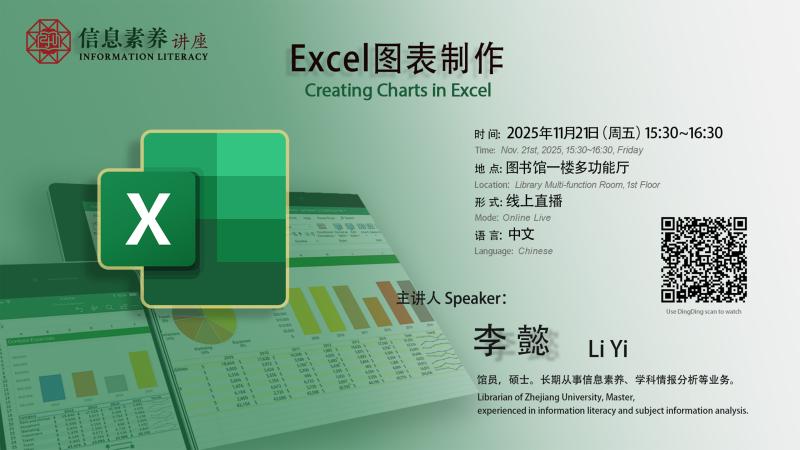
Excel is a professional-level spreadsheet software and powerful data visualization tool that can be used for various data processing, statistical analysis and auxiliary decision-making operations, widely used in management, statistics, finance and many other fields. Do you know Excel's amazing skills? Faced with different data needs, how to use Excel flexibly to achieve your purpose? This lecture will take you away from the maze of data through examples, and you will learn to tell stories with data and finally show the beauty of data.
Speaker: Li Yi
Introduction: Librarian of Zhejiang University, Master, experienced in information literacy and subject information analysis.
Time: Nov. 21st. 2025, 15:30~16:30, Friday
Location: Library Multi-function Room, 1st Floor
Mode: Online live
Language: Chinese
Participants: All
For videos of past lectures and more lectures information, please visit the library’s website at the following link: https://lib.intl.zju.edu.cn/zh-hans/learning-research-support/information-literacy-training-schedule
【Your Voice Matters】
If you have any desired lecture topics or other suggestions for information literacy lectures, please feel free to send your feedback to us library@intl.zju.edu.cn.
Library
Nov. 20th, 2025